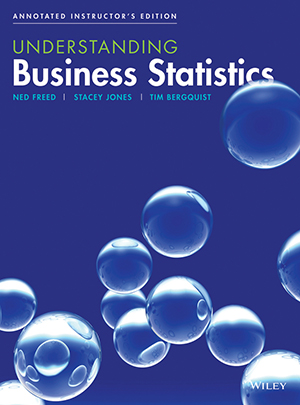
Understanding Business Statistics
By Ned Freed, Stacey Jones, Tim Berquist
Written in a conversational tone, Understanding Business Statistics presents topics in a systematic and organized manner to help students navigate the material. Demonstration problems appear alongside the concepts, which makes the content easier to understand. By explaining the reasoning behind each exercise, students are more inclined to engage with the material and gain a clear understanding of how to apply statistics to the business world.
Schedule a Demo Sign Up for a Test Drive Adopt WileyPLUSWant to learn more about WileyPLUS? Click Here
Conversational Narrative
The accessible writing style speaks to students, not at them, to make the concepts of Business Statistics more approachable.
Real-world Data
Infused throughout the text are real-life data and real-world business examples to help students understand not only how, but also why business decisions are made.
WileyPLUS
The research-based, online environment for effective teaching and learning provides practice questions with instant feedback, automatically graded homework and testing, a complete e-book and a suite of teaching and learning resources.
Business Scenarios
Each chapter includes an opening case of an interesting business-related story and throughout the text are high-interest examples that help students see statistical information in context. With Freed, students can grasp data analysis as they build an appreciation for the role business statistics plays in making sound business decisions.
NED FREED
With more than 30 years of experience as an award-winning teacher and researcher in the area of statistics and quantitative methods, Ned Freed has served on the faculties of the Naval Postgraduate School in Monterey, California and the University of Portland, in Portland, Oregon. Professor Freed graduated from Boston College with a BS in mathematics, earned an MBA from the Wharton School at the University of Pennsylvania, and holds a PhD in management science from the University of Colorado. He has authored a number of articles dealing with mathematical programming applications to statistical problems and has worked extensively with Prof. Fred Glover at the University of Colorado to produce linear programming alternatives to conventional methods of multivariate statistics.
TIM BERQUIST
Tim Berquist has been a Professor of Quantitative Analysis at Northwest Christian University in Eugene, Oregon since 1996. He has more than 25 years of teaching experience at schools that include South Dakota State University, the University of Oregon, and Oregon State University. He earned a BS in Mathematics from the University of Portland, an MS in Statistics from the University of Louisiana at Lafayette, an MBA from Santa Clara University, an MS in Operations Research from Oregon State University, and a Ph.D. in Decision Sciences from the University of Oregon. Dr. Bergquist has published or written numerous articles and manuals, and has presented more than 50 papers at professional conferences. He is the co-winner of the 2010 Decision Sciences Institute Instructional Innovation Award Competition and the recipient of the 2013 President’s Award for Teaching Excellence and Campus Leadership.
STACY JONES
Stacey Jones is a member of the Economics Department of the Albers School of Business and Economics at Seattle University, where she teaches several sections of introductory statistics and quantitative methods courses each year. Her students speak highly of her clarity, humor, and concreteness. Many of her courses incorporate service-learning projects that help students understand the relevance of statistical methods in addressing real-world problems. She holds a BA in philosophy from Carleton College, a Ph.D. in economics from Stanford University, and has authored a number of publications on discrimination and inequality in higher education and the labor market.
Chapter 1 – An Introduction to Statistics
Chapter 2 – Descriptive Statistics I: Elementary Data Presentation and Description
Chapter 3 – Descriptive Statistics II: Additional Descriptive Measures and Data Displays
Chapter 4 – Probability
Chapter 5 – Discrete Probability Distributions
Chapter 6 – Continuous Probability Distributions
Chapter 7 – Statistical Inference: Estimating a Population Mean
Chapter 8 – Interval Estimates for Proportions, Mean Differences and Proportion Differences
Chapter 9 – Statistical Hypothesis Testing: Hypothesis Tests for a Population Mean
Chapter 10 – Hypothesis Tests for Proportions, Mean Differences and Proportion Differences
Chapter 11 – Basic Regression Analysis
Chapter 12 – Multiple Regression
Chapter 13 – F Tests and Analysis of Variance
Chapter 13 – (part 2) Experimental Design (Online Only)
Chapter 14 – Chi-Square Tests
APPENDIX A: Tables
APPENDIX B: Answers to selected even-numbered exercises

