Foundations of Data Analytics, 1st Edition
By John W. Foreman, Ken Black, R. Kelly Rainer, Brad Prince, Hugh J. Watson, Steve Wexler, Jeffrey Shaffer, Andy Cotgreave
We are in the midst of a big data revolution and college graduates who demonstrate fluency in data analytics will have a leg up in today’s competitive job market.
Created in partnership with the Business-Higher Education Forum (BHEF), Foundations of Data Analytics, 1st Edition is an interdisciplinary course for non-majors that considers the implications of the creation, collection, and dependence on data for individuals and society. Requiring only a minimal prerequisite knowledge of statistics and programming, students develop familiarity with applied business analytics and basic knowledge of statistics and computer programming, so they can enter organizations as high functioning contributors.
The next generation of WileyPLUS for Data Analytics gives instructors the freedom and flexibility to tailor content and easily manage their course to keep students engaged and on track.
Schedule a Demo Sign Up for a Test Drive Adopt WileyPLUSWant to learn more about WileyPLUS? Click Here

Created in partnership with the BHEF
The Business-Higher Education Forum (BHEF) is the oldest membership organization of Fortune 500 CEOs, college and university presidents, and other leaders dedicated to the creation of a highly skilled future workforce.
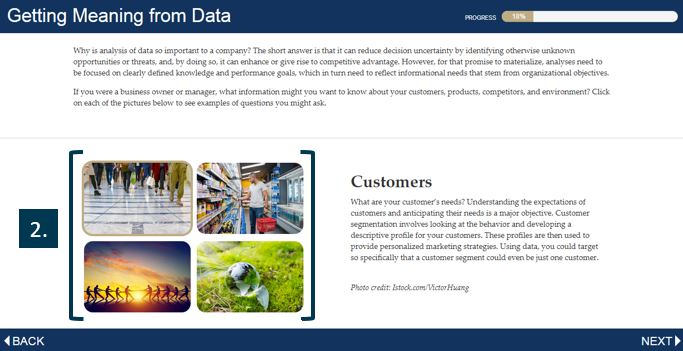
Interactive Lessons, Video Tutorials and Case studies meet students where they are and help them think critically.
Interactive Lessons and Video Tutorials provide students with easy, step-by-step instruction. Case studies with real data sets give students the opportunity to apply their learning in real-world scenarios.
- Downloadable VitalSource e-Book so students can access readings offline
- Continuing Case Study featuring real data sets helps students recognize good data and how to manipulate it
- Knowledge checks make it easy to identify where students need additional practice
- Modular format makes it easy for instructors to customize the content to fit their syllabus
- Readings are from key Wiley authors, including Foreman, Data Smart; Rainer, Management Information Systems; and Black, Business Statistics
What’s New
John W. Foreman is Chief Data Scientist for MailChimp.com, where he leads a data science product development effort called the Email Genome Project. As an analytics consultant, John has created data science solutions for The Coca-Cola Company, Royal Caribbean International, Intercontinental Hotels Group, Dell, the Department of Defense, the IRS, and the FBI.
Ken Black is professor of decision sciences in the School of Business at the University of Houston-Clear Lake (UHCL). Born in Cambridge, Massachusetts, and raised in Missouri, he earned a bachelor’s degree in mathematics from Graceland University, a master’s degree in math education from the University of Texas at El Paso, and a Ph.D. in business administration (management science) and a Ph.D. in educational research from the University of North Texas. Since joining the faculty of UHCL in 1979, Black has taught all levels of statistics courses, forecasting, management science, market research, and production/operations management. In 2005, he was awarded the President’s Distinguished Teaching Award for the university. He has published over 20 journal articles and 20 professional papers, as well as two textbooks: Business Statistics: An Introductory Course and Business Statistics: For Contemporary Decision Making. Black has consulted for many different companies, including Aetna, the city of Houston, NYLCare, AT&T, Johnson Space Center, and Southwest Information Resources.
Dr. R. Kelly Rainer is George Phillips Privett Professor of Management Information Systems at Auburn University. He received his B.S. degree in Mathematics from Auburn and his Ph.D. from the University of Georgia. Dr. Rainer has published numerous articles in leading journals. His research interests include enterprise resource planning (particularly using SAP), business process reengineering, and object-oriented technology. He recently spent a year with IBM’s Object Technology Practice.
Dr. Brad Prince is an Associate Professor of Information Systems at the University of West Georgia. Professor Prince received his MBA and Ph.D. from Auburn University working closely with Kelly Rainer. As a contributing author on the Rainer series, Professor Prince wrote the Ruby’s Club cases and exercises for both Rainer titles as well as the section-level activities.
Dr. Hugh J. Watson is a Professor of MIS and a holder of a C. Herman and Mary Virginia Terry Chair of Business Administration in the Terry College of Business at the University of Georgia. Hugh is a leading scholar and authority on business intelligence and analytics, having authored 24 books and over 150 scholarly journal articles. Hugh helped develop the conceptual foundation for decision support systems in the 1970’s, researched the development and implementation of executive information systems in the 1980’s, and for the past twenty years has specialized in data warehousing, BI, and analytics. Dr. Watson has consulted with numerous global organizations, including the World Bank, Intel, IBM, Conoco, and Glaxo, and conducted hundreds of executive development programs. Hugh is a Fellow of the Association for Information Systems and The Data Warehousing Institute and is the Senior Editor of the Business Intelligence Journal. He is also the founder of the Teradata University Network, a free portal for faculty and students who want to learn about data warehousing, BI/DSS, analytics, and database. For 20 years, Hugh was the consulting editor for John Wiley & Sons™ MIS series.
Steve Wexler is the Founder and Principal of Data Revelations. He has helped scores of organizations worldwide understand and visualize their data.
Jeffrey Shaffer is the VP of Information Technology and Analytics at Unifund and Adjunct Professor teaching Data Visualization at the University of Cincinnati.
Andy Cotgreave is Technical Evangelist at Tableau and writes the Living With Data column for ComputerWorld.
Module 1: The Value of Data
Give examples of how the analysis of data has led to discovery and innovation.
Describe how data can be used to reduce uncertainty and risk related to organizational decisions.
Reveal the risks of poor data management.
List examples of data sources.
Summarize the uses of predictive and descriptive data mining.
Contrast developed and emergent analytics.
Explain how to mitigate the negative consequences that can arise when using data analytic models to predict human behavior.
Module 2: Working with Data
Perform data exploration using Microsoft Excel.
Apply advanced skills in Microsoft Excel to analyze large amounts of information.
Discuss common errors made when using formulas in Microsoft Excel.
Evaluate how the collation and analysis of multiple sources of data can impact organizational decisions.
Compile relevant data from external sources.
Summarize patterns and insights gleaned from data analysis.
Construct well-designed tables and graphs that effectively communicate important information.
Module 3: Data Typologies and Governance
Describe what data represents.
Explain how data can be classified, captured, and formatted.
Differentiate common data typologies.
Explain how to capture, store and retrieve information from unstructured data.
Compare data warehouses and data lakes.
Describe the dimensions of data quality.
Explain some of the common data cleaning and preparation methods.
Contrast Online Transaction Processing (OLTP) and Online Analytical Processing (OLAP).
Explain the stages of the data life cycle.
Design a data collection system that enables users to efficiently prepare, explore, and interpret data.
Module 4: Business Statistics
Explain the measurement scales applied to data.
Summarize data using statistical terms.
Contrast different descriptive and predictive data mining methods.
Contrast data sampling techniques.
Discuss the importance of accounting for variable interactions.
Apply the rules of probability.
Explain the application of the Central Limit Theorem.
Apply hypothesis testing to a scenario.
Module 5: Optimizing and Forecasting
Differentiate correlation and causation.
Give examples of how linear regression is used in organizations.
Perform regression analysis using Microsoft Excel.
Interpret the output of a regression analysis.
Use Microsoft Excel to solve linear programming problems.
Interpret the output of a linear programming optimization simulation.
Module 6: Other Data Analytic Tools
Explain the use of a NoQL database.
Explain how Apache Hadoop’s MapReduce works.
Describe how Natural Language Processing (NLP) is applied to text mining.
Relate how graph analytics can be applied within different fields.
Perform data analysis using R.
Module 7: Data Visualization
Interpret data analysis in non-technical language.
Recommend visualization strategies for different types of data, purposes, and audiences.
Illustrate how the effective use of visual design components can lead to clear and efficient communication.
Create a compelling statistical narrative through data visualizations.